Steam store analysis using Tableau
Posted on: 20 April, 2023
Valve's Steam video game store is one of the most popular online game stores in the world, offering millions of gamers access to thousands of video games across various categories. As a analyst, I was interested in exploring the Steam game store and analyzing its performance using data visualization tools.

Steam was launched as a software client in September 2003 as a way for Valve to provide automatic updates for their games, and expanded to distributing third-party game publishers' titles in late 2005 as per wikipedia.
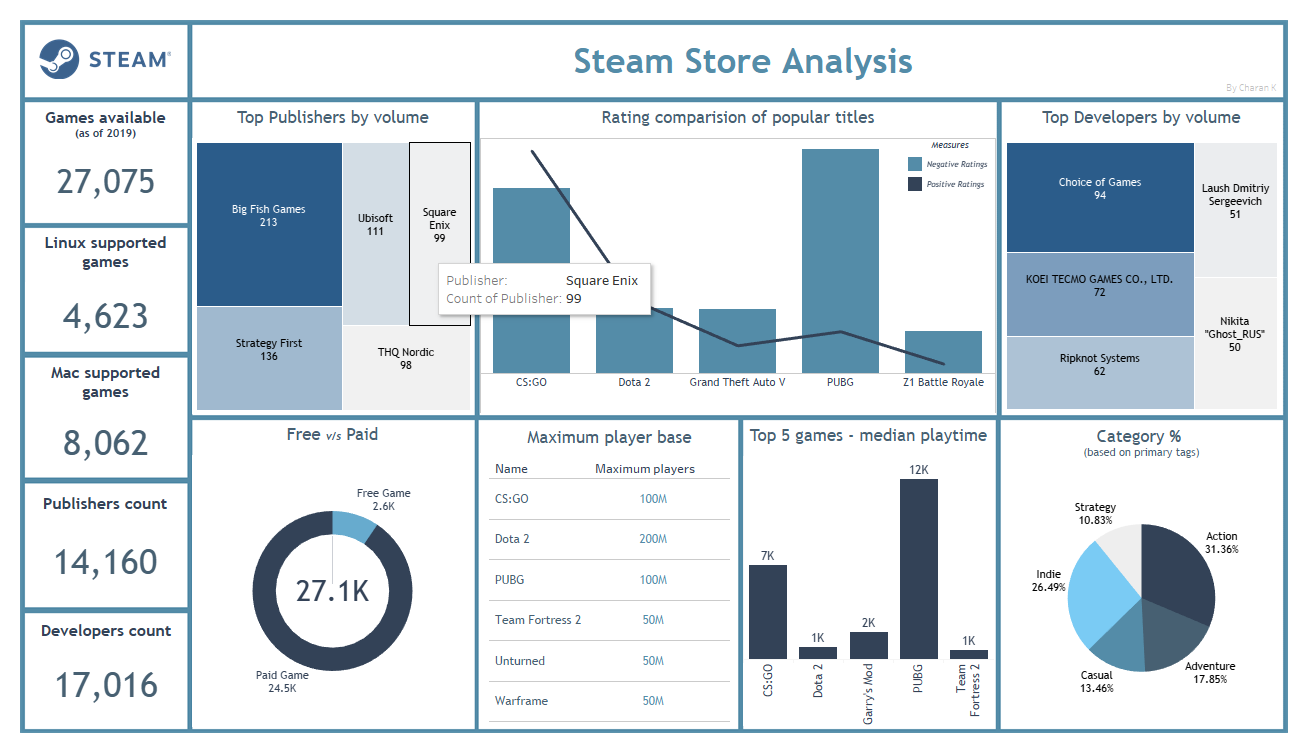
To achieve this, I made use of several tools, including Tableau for visualization, MS Excel for data cleaning and column splitting, and MySQL for drawing insights. The dataset used for this analysis was downloaded from Kaggle and added by Nik Davis in 2019. The dataset contains combined data of 27,000 games scraped from Steam and SteamSpy APIs. During the initial dashboard design, I made use of MS PowerPoint to plan the layout and ensure that it was visually appealing. Additionally, I used colorhunt.co to select the accurate color palette for the visualization. Which helped to give the dashboard a realist and sleek look.
The dashboard contains several key performance indicators (KPIs), including the number of games, and average rating analysis. I also included a section on the top five games, which highlighted the most popular games based on the number of players. Furthermore, I analyzed the games by category, including action, adventure, and strategy, among others. This allowed me to determine which categories were most popular among gamers. I also included a comparison of free versus paid games, which provided insight into the preferences of gamers when it came to paying for games. Finally, I included sections on the top publishers and developers by volume, which helped to identify the companies that produced the most games and had the greatest impact on the Steam game store. Overall, the analysis of Valve's Steam game store using Tableau, MS Excel, and MySQL provided valuable insights into the performance of the store and the preferences of gamers. The resulting dashboard provided a visually appealing and informative overview of the data, making it easy to understand and interpret the results.
Resources:
1) Steam Store Games (Clean dataset)
Link to Tableau public repo:
Publication link: Steam Store Analysis by Charan K